Trend line analysis provides traders with essential directional insights by connecting significant price points on financial charts to identify market trends and potential trading opportunities. Effective trend lines require multiple price touches for validation, while proper implementation involves analyzing multiple timeframes, confirming breakouts with volume, and maintaining strict risk management protocols. Understanding the nuances of trend line drawing and trading techniques enables market participants to develop thorough analytical frameworks that enhance their strategic decision-making capabilities.
Key Takeaways
- Connect significant price swing highs or lows with a straight line, requiring at least two touches for validation.
- Start analysis from higher timeframes and work down, confirming trends across multiple time periods.
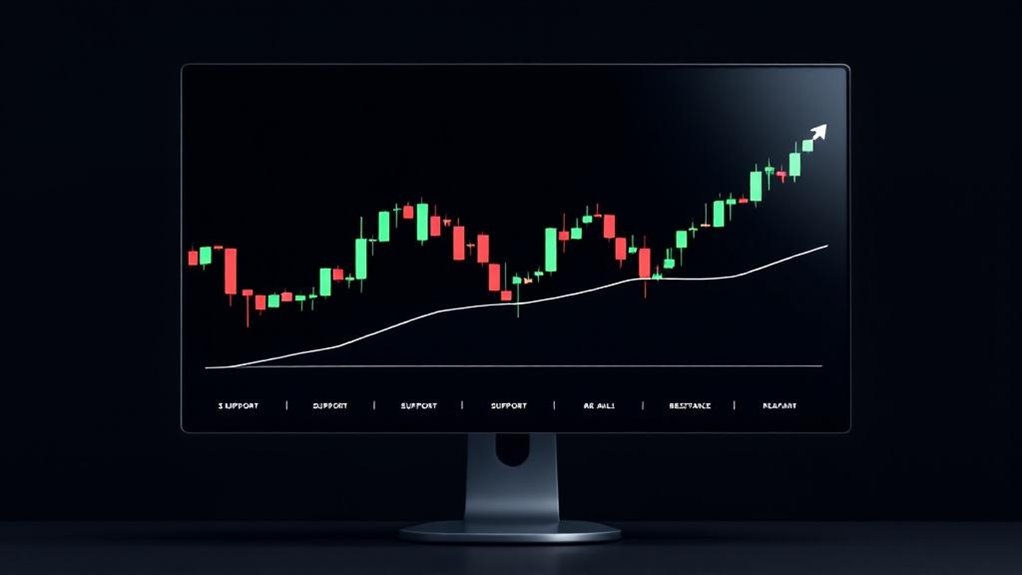
- Use trend lines as dynamic support and resistance levels, with breakouts signaling potential trading opportunities.
- Combine trend line analysis with volume indicators and other technical tools for more reliable trading signals.
- Set clear stop-loss orders beyond trend lines and maintain proper position sizing to manage trading risks.
Understanding the Fundamentals of Trend Lines
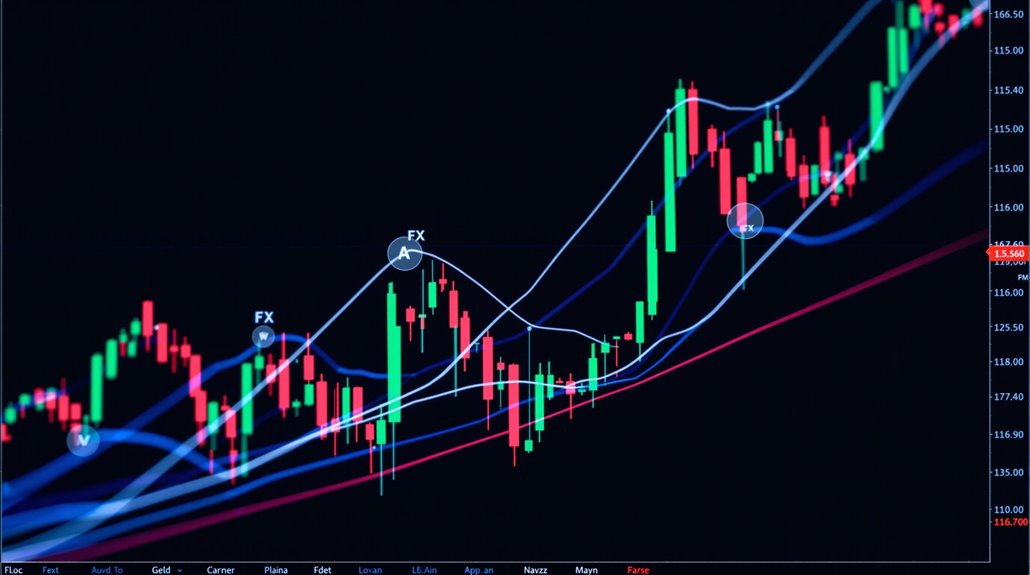
While trend lines represent one of the most fundamental tools in technical analysis, their importance in identifying market direction and potential trading opportunities cannot be overstated. These essential visual elements connect significant price points to reveal the prevailing market direction, serving as a cornerstone of technical trading strategies.
The trend line basics encompass connecting a minimum of two, preferably three or more, price points to establish valid market patterns. Their significance in trading manifests through their dual function as support and resistance indicators, with uptrend lines connecting higher lows and downtrend lines linking lower highs. Traders closely monitor trends across multiple time frames to gain comprehensive market insights.
Trend lines connect key price points, acting as vital support and resistance levels while revealing market patterns through highs and lows.
Technical analysts utilize these diagonal lines to distinguish between bullish, bearish, and neutral market conditions, filtering out short-term price fluctuations to reveal underlying trends. Similar to moving average crossovers, trend line breaks can signal potential market reversals and trading opportunities.
The intersection of price with established trend lines often generates actionable trading signals, enabling market participants to make informed decisions about position entry and exit points.
Essential Tools for Drawing Accurate Trend Lines
As technical analysts seek to draw precise and reliable trend lines, mastering the essential tools and platforms designed for this purpose becomes paramount to their success.
Modern charting software equips traders with sophisticated drawing tools and customization settings that greatly enhance trendline accuracy. Users can select from analysis type options ranging from basic long-term trends to highly sensitive short-term patterns.
Advanced platforms offer extensive validation techniques through built-in features that enable precise anchor point selection and automated trendline detection. These software features include snap-to-price functionality, customizable line properties, and robust filtering options to identify noteworthy trends.
Professional drawing techniques are enhanced through complementary analysis aids, such as Fibonacci tools, volume overlays, and multi-timeframe validation capabilities. Understanding position sizing principles helps traders maintain disciplined risk management when executing trend-based trades. Traders can leverage trendline filtering parameters to focus on high-quality setups while excluding noise from their analysis.
The integration of horizontal support/resistance lines, chart annotations, and cross-reference tools further strengthens the analytical framework, enabling traders to make well-informed decisions based on extensive technical evidence.
Mastering Different Types of Trend Line Patterns

Technical analysts must master numerous trend line pattern categories to effectively interpret market movements and make informed trading decisions. The most significant patterns include reversal indicators like the Double Top and Rounding Bottom formations, which signal potential trend changes.
Continuation patterns encompass several key formations, including the Pennant Formation, Flag Pattern, and Wedge Patterns, each indicating temporary consolidation before trend resumption. Successful traders combine these patterns with risk management techniques to optimize their trading strategies.
The Ascending Triangle, Symmetrical Triangle, and Descending Triangle formations provide vital insights into potential price direction through their distinctive converging trend lines. Traders often confirm these triangle patterns by analyzing volume breakout signals which validate the strength of price movements.
The Cup Handle pattern and various Consolidation Zone formations offer additional analytical frameworks for identifying potential breakout opportunities.
These patterns, when properly identified and confirmed with volume analysis, enable traders to anticipate price movements with greater precision and develop more effective entry and exit strategies in both trending and ranging markets.
Key Strategies for Trading With Trend Lines
Successful trend line trading requires mastering several fundamental strategies that form the foundation of effective technical analysis and market timing. Understanding trend line psychology and recognizing ideal breakout environments enables traders to execute precision entries while maintaining disciplined risk parameters. Starting analysis from monthly time frames provides the most comprehensive view for establishing reliable trend lines. Similar to MACD divergence analysis, trend line strategies help identify potential market reversals and continuation patterns.
| Strategy Component | Key Action | Risk Consideration |
|---|---|---|
| Entry Validation | Test multiple timeframes | Set stops beyond trend line |
| Breakout Confirmation | Monitor volume surge | Wait for retest completion |
| Support/Resistance | Track flip dynamics | Avoid choppy price action |
| Pattern Recognition | Identify confluence zones | Maintain position sizing |
| Exit Planning | Define opposing trend lines | Monitor reversal signals |
Professional traders systematically evaluate trend line setups through detailed technical analysis frameworks. This approach incorporates volume analysis, multiple timeframe confirmation, and strict adherence to predetermined risk parameters while monitoring price action near established trend lines for high-probability trade opportunities.
Advanced Trend Line Analysis Techniques

Advanced trend line analysis expands upon foundational concepts by incorporating sophisticated mathematical modeling and multi-dimensional technical frameworks. The integration of polynomial, logarithmic, and moving average trendlines enables traders to adapt to complex market movements with greater precision.
Trendline adaptability becomes essential when analyzing multiple timeframes and asset classes simultaneously. Through careful volatility assessment, traders can adjust their trendline parameters to account for market-specific characteristics and fluctuations. Successful traders recognize that trendlines should be treated as dynamic zones rather than fixed lines.
Mastering trendline flexibility across diverse market conditions enables traders to fine-tune their analysis and adapt to varying volatility patterns.
The confluence of technical indicators with advanced trendline methods strengthens trading decisions. Moving averages, oscillators, and momentum indicators provide additional validation points when aligned with trendline signals. Traders often incorporate RSI divergence patterns to confirm potential trend reversals and market turning points.
Professional traders leverage these sophisticated techniques to identify potential reversal zones and manage risk effectively. The analysis of repeated trendline tests, combined with volume and indicator confirmation, helps distinguish genuine breakouts from false signals, enabling more precise entry and exit points in trending markets.
Common Trend Line Trading Mistakes to Avoid
Many traders compromise their analysis by forcing trend lines onto price charts without adequate technical confirmation, resulting in misguided trading decisions based on arbitrary lines rather than genuine market structure.
The practice of repeatedly adjusting failed trend lines to fit evolving price action undermines the integrity of technical analysis and reflects a cognitive bias toward maintaining preconceived directional views. Drawing trend lines requires connecting swing points rather than relying on subjective interpretations that lack proper anchor points. Identifying double tops and similar reversal patterns can provide additional validation for trend line placements.
Thorough trend line analysis necessitates evaluation across multiple timeframes to validate trading signals, as confirmation from higher timeframes greatly enhances the reliability of identified support and resistance levels.
Forcing Lines Without Confirmation
While traders may be tempted to draw trend lines hastily based on minimal price action, forcing trend lines without proper confirmation represents one of the most detrimental mistakes in technical analysis. The psychology behind premature trend line drawing often stems from confirmation bias and enthusiasm to validate preexisting market views. Drawing trend lines effectively requires viewing them as dynamic zones rather than exact price levels. Maintaining strict risk parameters helps prevent overexposure when trading trend line setups.
| Confirmation Requirements | Impact on Trading |
|---|---|
| Minimum 3 Price Touches | Validates Support/Resistance |
| Multi-Timeframe Analysis | Strengthens Signal Reliability |
| Technical Indicator Alignment | Reduces False Breakouts |
| Price Action Confirmation | Improves Entry Timing |
Establishing legitimate trend lines demands rigorous validation through multiple price touches, technical confluence, and clear price action signals. Without proper confirmation, traders risk exposure to whipsaws, false breakouts, and suboptimal trade execution, ultimately compromising their strategic advantage in market analysis.
Over-Adjusting Failed Trend Lines
Experienced traders frequently fall into the detrimental practice of over-adjusting failed trend lines, a behavior that undermines the fundamental integrity of technical analysis and compromises trading effectiveness.
This pattern of continuous trend line adjustments often stems from emotional trading responses rather than objective market analysis.
When traders repeatedly modify invalidated trend lines to fit current price action, they create a dangerous cycle of confirmation bias and distorted market perception. Valid trend lines require at least two touches from price action to establish credibility.
The practice not only erodes analytical objectivity but also leads to poor trade execution and risk management failures.
Professional technical analysts emphasize maintaining original trend line positions, as shifting them after breaches effectively reinvents historical conclusions.
Combining trend line analysis with moving averages can provide more reliable confirmation signals for potential market reversals.
Proper trend line construction demands consistent criteria and respect for clear pivot points, while arbitrary adjustments negate the predictive value of technical analysis.
Ignoring Multiple Timeframes Analysis
Beyond the pitfalls of trend line adjustments lies an equally notable challenge in technical analysis: the common oversight of multiple timeframe analysis when trading with trend lines.
Among the most critical trend analysis pitfalls, this oversight can greatly diminish trading effectiveness and precision.
Understanding price action patterns across different timeframes provides clearer insights into genuine market movements without indicator lag.
- Single timeframe analysis frequently misrepresents the broader market direction, leading traders to position against dominant trends visible on higher timeframes.
- Failure to identify confluence zones across multiple timeframes reduces the reliability of support and resistance levels.
- Entry and exit timing becomes imprecise without the context of higher timeframe structures.
- Overtrading commonly results from reacting to minor price movements visible only on lower timeframes.
The multi timeframe benefits become evident through enhanced trade filtering, improved market context comprehension, and notably more reliable trend line placement across various time horizons. Traders should maintain top-down analysis to ensure their trend line strategies align with the broader market narrative and sentiment.
Combining Trend Lines With Technical Indicators
Technical traders can greatly enhance their analytical capabilities by integrating trend lines with multiple technical indicators, creating an extensive framework for market interpretation and decision-making.
The combination of various technical tools provides a thorough approach to validating trading signals and managing risk effectively. Selecting indicators from different categories helps avoid redundant signals that could lead to false confidence.
Moving averages serve as dynamic support and resistance levels, confirming trend line breaks and providing additional validation through crossover signals. Volume analysis reinforces trend line breakouts, with increased volume supporting legitimate moves while low volume suggests potential false signals.
Strong volume during trend line breakouts validates true market moves, while weak volume often signals potential market fakeouts.
Momentum indicators like RSI and MACD identify overbought or oversold conditions near trend lines, while volatility indicators such as Bollinger Bands help define ideal entry and exit points. The Bollinger Squeeze strategy is particularly effective when price action tightens near major trend lines.
Pattern recognition becomes more reliable when trend lines intersect with multiple technical setups, creating high-probability trading opportunities.
This integrated approach allows traders to develop sophisticated strategies that incorporate price action analysis, risk management, and systematic trade execution protocols.
Real-World Examples of Successful Trend Line Trading
Real-world application of trend line analysis demonstrates the effectiveness of combining multiple technical approaches through concrete trading examples across various markets and timeframes.
The empirical evidence from cryptocurrencies DOT/USD and SOL/BTC validates trend line effectiveness in generating profitable trading opportunities.
- DOT/USD exhibited a classical bullish breakout pattern after respecting both upper and lower trend lines, resulting in a 100% price appreciation following the confirmed breakout entry.
- SOL/BTC demonstrated the power of support trend lines through multiple touches, each providing high-probability entry points with clearly defined risk parameters.
- Confluence scenarios where trend lines intersect with horizontal support/resistance zones produced enhanced probability setups with decisive price reactions. Traders who utilized aggressive entry tactics at the first touch of significant trend lines achieved optimal positioning for maximum profit potential.
- Breakout-retest patterns consistently delivered reliable entry opportunities, particularly when validated by multiple trend line touches and proper risk management protocols.
The documented success of these real world applications reinforces the fundamental importance of trend line analysis in systematic trading approaches.
Frequently Asked Questions
How Do Trend Lines Perform During Extreme Market Volatility or Black Swan Events?
During extreme market volatility and black swan events, trend line resilience markedly diminishes as price action becomes erratic and unpredictable.
The volatility impact manifests through increased false breakouts, rapid trend line violations, and reduced reliability of traditional support/resistance levels.
Statistical analysis shows that during periods of heightened market stress, such as the 2008 financial crisis or 2020 pandemic, trend lines frequently fail to maintain their predictive value, necessitating supplementary technical indicators and modified risk management approaches.
Can Trend Lines Predict Exact Price Targets for Upcoming Market Reversals?
During the 2008 financial crisis, even well-established trend lines failed to predict the exact reversal point of the S&P 500‘s dramatic decline, illustrating a fundamental limitation of technical analysis.
While trend lines can identify potential zones of support and resistance, their predictive accuracy is constrained by complex market psychology and dynamic price action.
Trend lines serve better as probabilistic guidance tools rather than precise price target predictors, requiring integration with other technical indicators for more reliable trading signals.
Which Chart Timeframe Shows the Most Reliable Trend Line Signals?
Higher timeframe charts, particularly daily and weekly, demonstrate superior reliability for trend line signals compared to shorter intervals.
While short-term trends on 5-minute or 15-minute charts often produce noise and false signals, long-term trends visible on daily/weekly timeframes offer more substantial validation through multiple price touches.
These extended timeframes effectively filter out market volatility and provide stronger predictive value, especially when confirmed by three or more contact points.
Do Algorithmic Trading Systems Use Trend Lines in Their Decision-Making Processes?
Like an orchestra conductor directing multiple instruments, modern algorithmic trading systems extensively incorporate trend line interpretations into their decision-making processes.
Advanced algorithms analyze multiple timeframes simultaneously to identify support, resistance, and breakout levels. These systems integrate trend line data with other technical indicators to generate trade signals, manage risk parameters, and optimize entry/exit points.
The automation guarantees consistent, objective trend analysis while eliminating emotional bias from trading decisions.
How Do Different Asset Classes Affect the Reliability of Trend Line Analysis?
Asset class characteristics greatly influence trend line reliability across different markets.
Equity markets typically display clearer trends due to higher volatility and pronounced price swings, while cryptocurrency trends often exhibit extreme fluctuations that can distort traditional trend analysis.
Commodity fluctuations frequently reflect cyclical patterns and external shocks, reducing trend line effectiveness.
Forex correlations with macroeconomic factors can lead to sudden trend disruptions, making pattern identification more challenging in currency markets.
Conclusion
Trend line analysis remains an indispensable component of technical trading, enabling traders to identify, anticipate, and capitalize on market movements with precision and confidence. Through disciplined application of trend line principles, integration with complementary indicators, and vigilant attention to pattern recognition, traders can develop robust strategies that withstand market volatility. Whether analyzing uptrends, downtrends, or consolidation patterns, mastery of trend line techniques provides a systematic framework for making informed trading decisions.
References
- https://www.investopedia.com/terms/t/trendline.asp
- https://en.wikipedia.org/wiki/Trend_line_(technical_analysis)
- https://www.strike.money/technical-analysis/trend-lines
- https://www.fidelity.com/learning-center/trading-investing/technical-analysis/basic-concepts-trend
- https://www.gettogetherfinance.com/blog/understanding-trendline/
- https://www.investopedia.com/articles/trading/06/trendlines.asp
- https://chartschool.stockcharts.com/table-of-contents/chart-analysis/trend-lines
- https://thetradinganalyst.com/what-is-a-trend-line/
- https://help.trendspider.com/kb/automated-technical-analysis/trendline-customization-and-filtering
- https://www.tradestation.com/learn/using-tradestation/tradestation-desktop/quick-tips/chart-analysis/trendlines-and-drawing-tools-in-chart-analysis/