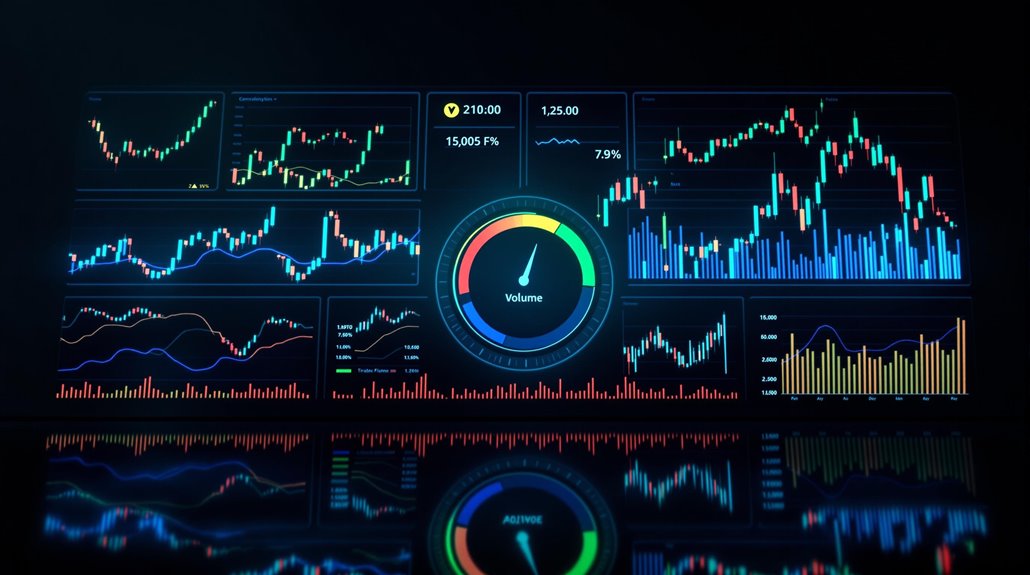
Key economic indicators provide essential data points for strategic market timing decisions, with GDP trends, employment metrics, and price level indicators serving as foundational analysis tools. Professional traders monitor the Bureau of Labor Statistics’ Employment Situation Report, PMI data, and CPI fluctuations to gauge market momentum and potential directional shifts. While sentiment measures like the VIX “fear index” offer supplementary insights, thorough analysis of multiple indicators reveals deeper patterns that can signal ideal entry and exit points.
Key Takeaways
- GDP trends provide crucial signals for market timing, with expanding figures typically indicating favorable conditions for bullish market positions.
- Employment data from the Bureau of Labor Statistics triggers market volatility and helps predict Federal Reserve policy decisions.
- Price level indicators like CPI and PPI guide monetary policy shifts, directly impacting asset valuations across different market sectors.
- PMI serves as a leading indicator of manufacturing sector health, offering early signals for broader market direction.
- Sentiment measures, including VIX and Put/Call ratios, help identify potential market turning points through psychological factor analysis.
Core Economic Growth Metrics and Market Impact

Economic growth metrics serve as fundamental gauges for market participants seeking to optimize investment timing decisions through macroeconomic analysis. These indicators provide critical insights into market dynamics and potential turning points.
GDP trends establish the baseline for economic health assessment, with expanding figures typically correlating to bullish market conditions. Investment strategies must consider the four production factors that drive economic output and market performance. GNP comparisons offer broader perspective by incorporating international income flows, particularly relevant in globally integrated markets.
CPI fluctuations signal inflationary pressures that can trigger monetary policy shifts, while PMI implications serve as leading indicators of manufacturing sector health and potential market direction. PCE analysis provides granular insight into consumer behavior patterns, which often precede broader market movements. Consumer confidence indices provide valuable forward-looking sentiment data that can help predict future market behavior.
Together, these metrics create an extensive framework for evaluating economic conditions and their impact on market timing decisions. Professional investors regularly monitor these indicators to identify potential market inflection points and adjust portfolio allocations accordingly.
Employment Data as Market Direction Signals
Employment metrics serve as essential barometers for market participants seeking to anticipate directional shifts in financial markets, with thorough labor data providing high-resolution insight into economic momentum and policy trajectories.
The Bureau of Labor Statistics‘ monthly Employment Situation Report catalyzes considerable market volatility, as investors recalibrate positions based on unexpected variations in employment trends. The Federal Reserve Bank provides comprehensive labor market data through interactive charts showing crucial employment indicators and market conditions.
Sector rotation strategies often shift based on employment data as different industries respond uniquely to labor market changes.
Key employment indicators that signal market direction include:
- Nonfarm payroll data and unemployment rates, which drive immediate asset price adjustments
- Job Openings and Labor Turnover Survey (JOLTS) metrics, revealing labor market dynamics through hiring, firing, and quit rates
- The Conference Board Employment Trends Index, aggregating multiple indicators for extensive trend analysis
Professional investors scrutinize labor market conditions through composite indices while monitoring Federal Reserve responses to employment data, as policy adjustments considerably influence market trajectories.
This multifaceted analysis of employment metrics enables sophisticated market timing strategies aligned with economic cycles.
Price Level Indicators and Investment Strategy

While sophisticated market participants routinely analyze an array of economic signals, price level indicators serve as foundational metrics for developing robust investment strategies and timing market entry and exit points. These indicators provide critical insights into market dynamics and potential turning points.
Price index analysis encompasses multiple tools, including the Consumer Price Index (CPI), Producer Price Index (PPI), and Price Level Index (PLI), which collectively illuminate pricing trends across different market segments. Central bank policymakers frequently adjust monetary policy based on these indicators. Technical indicators such as moving averages and support/resistance levels complement these broader measures by identifying specific entry and exit opportunities.
Price indices and technical analysis work in tandem to reveal market trends and pinpoint strategic trading opportunities across diverse economic sectors.
Investment diversification strategies particularly benefit from PLI analysis, as it enables investors to evaluate relative asset values across international markets and identify potential arbitrage opportunities. Using relative strength index alongside price level indicators can help confirm trend strength and potential market reversals.
The integration of price level indicators with volume-based metrics and momentum oscillators creates a thorough framework for evaluating market conditions and optimizing portfolio allocation decisions.
Monetary Policy Shifts and Market Response
Monetary policy shifts cascade through financial markets via complex transmission mechanisms, fundamentally altering asset valuations and investment dynamics across sectors.
Central bank policy communication and interest rate adjustments trigger multifaceted responses across asset classes, with varying temporal impacts on different market segments. During the Great Moderation period, economies experienced unprecedented stability in growth and inflation, providing valuable insights into policy effectiveness. Implementing strict position sizing helps investors manage exposure during volatile policy-driven market moves.
Market participants can optimize timing decisions by monitoring three critical transmission channels:
- Interest rate sensitivity – Rate-dependent sectors like real estate and financial services typically demonstrate immediate price movements following policy shifts.
- Exchange rate dynamics – Currency valuations rapidly adjust to policy divergence between major central banks, affecting international trade and corporate earnings.
- Forward guidance impact – Market expectations and pre-emptive portfolio adjustments often precede formal policy changes, particularly in bond and equity markets.
The transmission of monetary policy effects exhibits predictable patterns, with interest-sensitive sectors leading broader market adjustments by approximately 18 months, while services and employment metrics demonstrate more gradual responses.
Sentiment Measures for Market Momentum

Sentiment indicators serve as essential barometers for gauging market psychology and potential turning points in price momentum across financial markets.
Advanced sentiment analysis techniques, including the VIX “fear index” and Put/Call ratio, provide quantifiable metrics for evaluating collective market positioning and emotional extremes.
Sophisticated sentiment tools like VIX and Put/Call ratios reveal critical market psychology data, measuring crowd behavior at emotional peaks and troughs.
Technical measures like the Advance/Decline Line and Bullish Percent Index (BPI) offer objective data points for analyzing market breadth and participation levels. The widespread influence of behavioral finance theory demonstrates how psychological factors consistently shape investor decision-making and market outcomes.
Traders often monitor options pricing signals to anticipate future market volatility and potential directional shifts in asset prices.
The integration of multiple sentiment indicators, including survey-based metrics from AAII and composite indices like CNN’s Fear & Greed Index, creates a thorough framework for identifying potential market inflection points.
Professional traders particularly monitor divergences between price action and sentiment measures, as these disparities often precede significant market reversals.
Market psychology readings reaching extreme levels, whether reflecting excessive optimism or pessimism, frequently signal imminent shifts in market direction and momentum.
Frequently Asked Questions
How Do International Trade Balances Affect Domestic Market Performance?
Trade balances greatly influence domestic market performance through multiple channels.
Persistent trade deficits typically pressure currency values downward, potentially stimulating export growth but increasing import costs and inflation risks.
Market sectors respond differently: export-oriented companies may benefit from currency weakness, while import-dependent firms face margin compression.
Additionally, trade balance shifts often signal broader economic trends, affecting investor sentiment and capital flows across domestic equity markets.
What Role Do Housing Market Indicators Play in Predicting Economic Cycles?
Housing market indicators serve as powerful predictors of economic cycles through multiple interconnected signals.
Housing prices, construction activity, and buyer sentiment function as leading indicators that often precede broader market shifts by 6-12 months. Changes in mortgage rates and inventory levels directly impact consumer behavior and builder confidence, while market trends in new housing starts frequently herald economic turning points.
The NAHB/Wells Fargo Housing Market Index particularly demonstrates strong correlative value for forecasting cyclical economic changes.
How Do Government Debt Levels Influence Long-Term Market Trends?
Government debt levels considerably influence long-term market trends through multiple channels.
High debt burdens impact debt sustainability, potentially leading to increased borrowing costs and reduced private investment opportunities. Fiscal policy decisions aimed at managing debt levels can affect market sentiment, investment flows, and economic growth trajectories.
When debt-to-GDP ratios become elevated, markets often demand higher risk premiums, which can suppress equity valuations and alter investment patterns across asset classes.
Can Cryptocurrency Market Movements Serve as Reliable Economic Indicators?
While cryptocurrency markets captivate investors with dramatic price swings, their reliability as economic indicators remains questionable.
The extreme cryptocurrency volatility and susceptibility to non-economic factors like regulatory news and technological developments obscure genuine economic signals.
Market sentiment in crypto often diverges from fundamental economic conditions, with correlation coefficients to traditional indicators rarely exceeding 0.10.
Research indicates that cryptocurrencies currently lack the consistent predictive power necessary to serve as dependable economic benchmarks.
How Do Weather Patterns and Natural Disasters Impact Economic Indicator Reliability?
Weather fluctuations and natural disasters greatly compromise economic indicator reliability through multiple channels.
Severe weather events disrupt data collection processes, creating gaps in vital economic measurements and statistical reporting. During disaster recovery periods, standard economic indicators may reflect temporary distortions rather than fundamental economic conditions.
Infrastructure damage, business closures, and supply chain disruptions can lead to incomplete or delayed data reporting, potentially skewing analytical models and forecasting capabilities.
Conclusion
While market participants obsessively track economic indicators to divine future market movements, the irony remains that these carefully monitored metrics often fail to predict significant market turns. Despite sophisticated analysis of employment data, inflation measures, and Federal Reserve policies, markets frequently pivot on unexpected catalysts that defy conventional economic wisdom. This perpetual paradox underscores the humbling reality that timing markets through economic data alone remains an elusive endeavor.
References
- https://www.finra.org/investors/insights/key-economic-indicators-every-investor-should-know
- https://www.investopedia.com/articles/economics/08/leading-economic-indicators.asp
- https://pages.stern.nyu.edu/adamodar/New_Home_Page/invfables/mkttimingapproaches.htm
- https://www.newyorkfed.org/research/calendars/nationalecon_cal
- https://tradefundrr.com/market-timing/
- https://www.investopedia.com/terms/e/economicgrowth.asp
- https://www.core-econ.org/the-economy/macroeconomics/03-aggregate-demand-04-interpreting-gdp.html
- https://financialsource.co/4-key-economic-indicators/
- https://hmarkets.com/learn-to-trade/macroeconomics/economic-growth/
- https://www.rosenbergresearch.com/2024/06/05/economic-indicators-demystified-key-metrics-for-analysts/